Civils starts jump 34% while the wider market stalls
Glenigan's August index shows civils starts up 34% on the quarter while overall starts fell 11%. What the summer 2026 data means for clients planning work.
By Connor Lyons, Commercial director, MRICS
Generated by your browser's built-in AI. May not be fully accurate.
Two sets of construction data landed this month, and they tell the same split story. The Glenigan Index to the end of July 2026, which tracks project starts under £100 million, has overall starts down 11% on the preceding three months and 29% below the same period last year. Buried in the same release: civil engineering starts rose 34% on the quarter.
That is not a rounding error. Utilities starts alone were up 51% against the preceding three months, and infrastructure was up 24%. While housebuilding starts remain depressed, civils is the one part of the index showing a strong quarterly rise. If you are a client holding a scheme with a meaningful groundworks, drainage or utilities package, the data gives you a reason to test current capacity and pricing, not to assume what the market will offer.
What the August index actually says
The headline numbers are grim in the places everyone expected. Residential starts fell 25% on the quarter and stand 46% below last year, with social housing down 34% quarter-on-quarter. Non-residential starts slipped 4% against the preceding three months, dragged down by retail (down 30%) and education (down 42%).
But the sector detail is where the useful signal sits:
- Civil engineering starts rose 34% against the preceding three months, split between infrastructure (up 24%) and utilities (up 51%).
- Industrial starts rose 30% on the quarter, including a £74 million storage and distribution facility in Leicestershire.
- Office starts rose 25% quarter-on-quarter and are 34% up on last year, one of the few verticals in positive territory on both measures.
Glenigan’s named examples for the civils spike are telling: a £74 million recorded project-start value for the Culham River Crossing in Oxfordshire and a £68 million flood protection scheme in Dumfries. These are infrastructure projects, while the wider rise also includes regulated utilities activity. The mix is infrastructure-shaped, but the index does not identify the funding route for every project behind the increase.
One honest caveat before anyone declares a recovery: civils starts are still 15% below the same period last year. A 34% quarterly rise is a bounce off a weak spring, not a boom. The direction matters, the base matters just as much.
The ONS picture: output flat, orders falling
The ONS construction output bulletin for June 2026, published on 13 August, fills in the rest. Total output edged up 0.3% in the second quarter, with new work up 0.4%. Monthly output actually fell 0.1% in June. This is a market treading water.
Two figures stand out. First, infrastructure was the strongest of the nine sectors ONS tracks, with new work up 1.9% in the quarter, which lines up with what Glenigan is seeing on starts. Second, new orders fell 11.8% quarter-on-quarter, driven by private commercial and public other new work. Output is holding; the pipeline behind it is thinning.
There is also a pricing signal worth noting: annual construction output price growth ran at 1.9% in the year to June. The ONS describes its Construction Output Price Index methodology as a sector-wide proxy for output prices, not a live tender-price or contractor-capacity index. It shows that the broad inflation backdrop has cooled, but it cannot tell you what a particular civils package will price at today.
Why civils is the bit that is moving
The utilities rise sits alongside regulated investment cycles. The AMP8 water programme we covered in June is in its 2025 to 2030 delivery period, while energy network reinforcement continues to generate enabling works, substations, cable routes and connections. The Dumfries council decision records council and Scottish Government funding for the Whitesands scheme, so that example follows a public investment decision rather than speculative development demand.
That gives parts of civils a firmer demand base than purely speculative development, but it does not make every project or date fixed. For England, the Environment Agency’s published programme notes that allocations and delivery details can change. Regulated and publicly funded programmes support workload, while individual scopes, approvals and start dates still move.
The regional picture is uncomfortable, and worth testing
Glenigan’s regional breakdown makes hard reading almost everywhere. Against last year, starts are down 46% in the South East, 45% in the South West, 36% in Yorkshire and 31% in Scotland. Only London is in positive territory, and only just, at 1%.
For contractors that is painful. For clients it is a reason to test the market, not proof of automatic leverage. The regional figure covers all construction sectors and does not show the order book, capacity or tender position of individual civils contractors. A current soft-market test or tender is the only reliable way to establish who has the right team available and how they will price a defined package.
What to do with this if you hold a scheme
Test the market if your scope is ready. The figures make that test worthwhile, but they do not replace it. Issue a consistent scope, ask bidders to identify the proposed team and compare exclusions as carefully as the headline price.
Do not assume civils capacity stays available. Utilities were up 51% on the quarter, and regulated programmes may continue to absorb crews, plant and management. If your scheme needs utility connections, diversions or statutory undertaker interfaces, scope them early because unresolved interfaces can delay the main programme.
Read the orders data as context, not a contractor forecast. The 11.8% fall points to a thinner aggregate pipeline, but it does not tell you what sits in one contractor’s forward book. Ask bidders about committed workload and the named delivery team. Securing capacity early may require a pre-construction agreement, letter of intent or other commercial commitment, so agree the price, scope and risk allocation rather than assuming it costs little.
Judge your scheme on its own fundamentals. A quarterly bounce in civils starts says nothing about whether your unit will let, your yard will get planning, or your power connection will land on time. The data describes the market you are buying in, not the case for your project. The case still has to stand up on its own.
The summer 2026 data does not describe a recovery. It shows a quarterly rise in civils against a weak wider market, with funded and regulated programmes contributing to the workload. If your scope is sufficiently developed, it is a sensible moment to test the civils market without presuming the answer.
Connor Lyons is commercial director at Rospower Projects, MRICS. We deliver groundworks, drainage, utilities and external works packages for industrial, commercial and infrastructure clients across the UK. Contact us to discuss a planned package.
Sources and further reading
- Glenigan Index of construction starts to end of July 2026 (Glenigan, August 2026)
- Construction output in Great Britain: June 2026 (ONS, 13 August 2026)
- Ofwat’s £104bn water investment: AMP8 (Rospower Projects, June 2026)
Related articles

UK construction events 2027: dates confirmed
Confirmed 2027 UK construction, plant, utilities, energy and food manufacturing events, plus major calendars still awaiting dates as of August 2026.
Where logistics demand is still moving in 2026
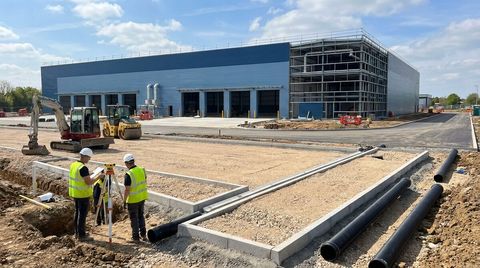
Demand is still showing up in build-to-suit logistics, Grade A warehouses and power-heavy yards. Here is what it means for civils scopes in 2026.
Subbie payment terms: the part of the job nobody prices
Long payment terms and retentions leave groundworks firms funding somebody else's project. Here is what the Construction Act gives you, and what it does not.